Crude oil production, refining, and combustion all produce heat and generate carbon dioxide (CO2), a powerful greenhouse gas.
How much heat is generated from burning one barrel of crude oil?
According to Statistics Canada1, burning 1 barrel of crude oil = 6.193 gigajoules,
or 0.6193 terajoules (TJ) of heat. For comparison’s sake, the Little Boy2 atomic bomb
dropped on Hiroshima released 62.8 to 66.9 ± 8.4 TJ—about 10,470 times more energy than is in a single barrel of oil.
In 2024 Alberta’s total GHG emissions were 260.1 MtCO2e (260,100,000 tonnes). Oil sands (mining, in situ,
upgrading) was 32.73% of that, oil and gas transmission and refining was 4.19%, and conventional oil
production was 7.08%3, so (leaving out natural gas production and
processing at 15.05%) 44% of Alberta’s GHG emissions in 2024 were from oil (114,444,000 tons of CO2).
In 2024 Alberta produced an average of 3.98 million barrels per day, or 1453.695 million per year. We can therefore
deduce that for Alberta crude oil production, one tonne of CO2 is released in the generation of 12.7022 barrels of oil
(1,453,695,000 barrels / 114,444,000 tons of CO2). This is an impressive figure, if accurate: I’ve seen estimates
that are several times higher. But let’s use the official Alberta government figures.
N.B.: The radiative forcing caused by greenhouse gases
released from oil production, refining, and combustion equals the heat that came from these activities very quickly: after only about 45 days.
According to “Time scales and ratios of climate forcing due to thermal versus carbon dioxide emissions from fossil fuels”
4 by Xiaochun Zhang and Ken Caldeira, the radiative forcing from released CO2 exceeds the amount of heat
generated by burning oil after about 45 days, and about 34 days for coal, and about 59 days for methane (natural gas).
This datum is key to understanding the rate and scale of anthropogenic global heating.
Only a small amount of those greenhouse gases are quickly absorbed by plants or the ocean; the rest stays in the atmosphere for a long time.
The Bern Simple Climate Model (BernSCM) v1.05
published by the European Geosciences Union Geoscientific Model Development (Articles, Volume 11, Issue 5, 25 May 2018)
describes types of carbon sequestration that operate at different time scales:
plants and upper ocean (years to decades),
deep ocean (centuries), and
geological processes (millennia).
Using a Pulse Response Model, these three significant processes get summed to provide the annual amount of carbon sequestered
from a pulse of CO2 released into the atmosphere. Unfortunately, all three are two-way processes—not so
much “sinks” as “banks”.
When a plant grows it absorbs CO2, but when it dies it releases CO2.
The upper ocean absorbs CO2 (and becomes more acidic, but that’s a different problem),
but depending upon the partial pressure, will release that CO2.
The deep ocean only absorbs CO2 if and when the thermohaline circulation is effective, such as that
driving the AMOC (Atlantic Meridional Overturning Circulation), and that’s becoming less effective as
surface water becomes less salty due to melting ice caps.
Even the rocks may be two-way streets for CO2: a recent paper in Nature6
reports that rock organic carbon oxidation CO2 release offsets the silicate weathering sink,
rivalling or even exceeding the CO2 drawdown by silicate weathering at the global scale. Therefore,
the geological component of the Pulse Response Model may be functionally zero, at least on human timescales.
Therefore, the naïve notion that CO2 is quickly and permanently absorbed by growing plants does not
accurately or adequately explain what we’re seeing, which is a continuous and accelerating buildup of CO2
ever since we first began to measure it. Some of what we put into the air now is still going to be there in
thousands of years, and is going to be duplicating the heat from combustion every 45 days. Nevertheless, some
CO2 is indeed absorbed, so once we estimate the annual reduction of CO2, we can derive
a matching reduction in radiative forcing due to that CO2.
Since we know how much heat is generated by burning a barrel of crude oil, if we also know how much CO2
is released in the process, we can model how much CO2 is absorbed over time, and how much remains to continue to trap infrared radiation and heat the planet.
How much CO2 is released per barrel burned? Envorem Calculations And Sources Used Across Our Site
says that 2.79 mass units (e.g. kilograms) of CO2 are generated per mass unit of oil burned, although I’ve seen higher
figures such as 3.15. And
What Is a Barrel of Oil Weight and Why Does It Matter in Industrial Applications?
says that a barrel of crude oil masses between 136 and 143 kilograms. Therefore, I deduce that between
379.44 and 399 kg of CO2 is released per barrel burned (or using the 3.15 ratio,
428.4 to 450.45 kg of CO2). The extra mass in the CO2 comes from the oxygen in the air.
Having a ratio between CO2 released from crude oil production and CO2 released
from crude oil combustion allows us to infer the ratio between the produced heat and the burned heat.
We also have data about the effects of refining. The Union of Concerned Scientists reports that
“a typical oil refinery in the United States consumes between 540 and 690 MJ and emits between 97 and 111
lbs of CO2 per barrel of crude oil refined.”7
Therefore, we can similarly deduce a ratio between the heat from refining and the heat from combustion.
Therefore, we can calculate the actual amount of global heating due to radiative forcing caused by greenhouse gases
emitted from a specific number of barrels of crude oil over a long time period. This is its “carbon legacy”.
I don’t think “carbon footprint” is an appropriate term for what we’re discussing here.
You use “carbon footprint” to estimate your current consumption of resources,
but the CO2 left in the atmosphere is your “carbon legacy”—what you leave for posterity.
Alberta current produces over four million barrels of crude oil per day, or almost 1.5 billion barrels per year.
To a first approximation, multiply the heat generated by burning oil by 8 to get the amount of heat generated annually from the CO2 released by burning. This ratio goes down as CO2 is absorbed, but this is not a quick process.
Applying this calculation to current and planned oil production from Alberta’s oil sands reveals interesting results.
In 2026 Prime Minister Carney and Premier Danielle Smith announced plans for a new pipeline to transport
a million barrels per day of crude oil from the Alberta oil sands to a deep-water Pacific port in British Columbia.
Furthermore, the Alberta government has announced its intent by 2035 to increase production to 8 million barrels of oil per day
8 despite the fact that the Alberta oil sands are among the most
carbon-intensive sources of crude oil in North America9.
Alberta, along with the Canadian federal goverment, has announced a plan to reduce the carbon dioxide
emitted during production. The Pathways Project10 aims to keep 16 million tons of
CO2 out of the atmosphere every year, reducing the emissions from the production process.
However, this would only handle about 1% of the total emissions from producing, refining, and burning 8
million barrels of oil - it’s a bandaid on a gaping wound, and uses unproven technology in any case.
Carbon sequestration projects have a habit of over-promising and under-performing, especially when required
to scale up to meaningful results.11
“Alberta Oil Production By Type”12 (accessed ) provided the following data starting in 2012.
Alberta has been producing oil since 190213, so I’m ignoring 110 years of oil in this chart.
Feel free to add 110 years’ worth of radiative forcing to my results if you feel so inclined.
Heat produced directly from manufacturing, refining, and burning the oil
Upstream production involves mining, drilling, diluting into bitumen, and transportation via pipeline, rail, and tanker.
Refining turns the crude oil into gasoline, jet fuel, diesel, fuel oils, petrochemical feedstocks, asphalt, etc.
Converting barrels into , here’s the immediate impact to global warming of
producing, refining, and burning this oil:
Remember that this is NOT warming due to greenhouse gas emissions! It is just the actual heat generated
by producing, refining, and burning. All those engines and power plants and factories...
The Carbon Legacy: heat produced indirectly from producing, refining, and burning the oil
You can see that Alberta’s carbon legacy for every year’s production trends very slightly
down, due to absorption of CO2 by plants and the upper ocean. However, since annual production
continues, and is increasing, the annual amount of global heating in 2026 just due to Alberta’s production since
2012 is about 17 million Hiroshimas.
Alberta’s plans for growth
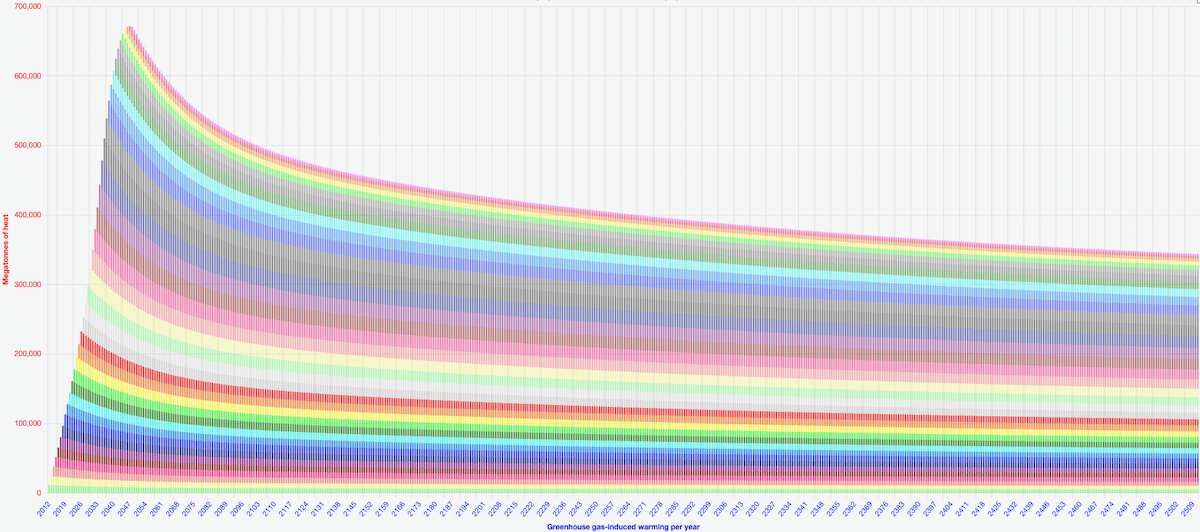
This chart models annual heating for years. Note that long after
oil production has stopped, its carbon legacy remains very much alive.
Each year’s impact trends slightly down. Unfortunately, it takes many millennia to reduce the annual heating down to almost nothing.
Long-term heating
No matter when Alberta finally stops producing oil, some of the CO2 released will fail to get absorbed quickly,
and stay in the atmosphere, continuing to capture reflected infrared from the planet’s surface, for millennia.
Here is my estimate of the long-term impact of Alberta’s entire 2012- oil production on
global heating. (Use the slider to change the number of years to forecast.)
years of global heating
Show my assumptions and tweak the variables in the
CO2 Pulse Response Model
Conclusion
I grew up learning about the relationship between greenhouse gas emissions and global warming, but only in terms
of global average temperature rise, or millions of tons of CO2, neither of which really stirred my
imagination or helped me to understand how much energy we are pumping into the ecosphere. I hope that the truly
horrifying numbers that are shown here, resulting only from a couple of dozen years of oil production, may prompt
readers to reconsider their priorities.
Should I try to calculate my personal carbon legacy for my tombstone? No—there’s no point. My CO2
will still be there, acidifying the ocean, exterminating species, causing weather disasters, and pushing climate change,
long after my tombstone erodes down to illegibility.
Our graves need no flowers: the air has recorded our names.14
Cheery Bonus Calculator
Here’s a calculator that tells you what the impact is of a barrel (or more) of crude oil.
14
A paraphrase of a line from Emerson, Lake, and Palmer’s
Karn Evil 9, 3rd Impression, specifically “Their graves need no flowers: the tapes have recorded their names.”